Profiling
Quick profiling in your terminal
Note
This is only meant to be used for quick profiling or programmatically accessing the profiling results. For more detailed and GUI friendly profiling proceed to the next section.
Simply replace the use of Base.@time or Base.@timed with Reactant.Profiler.@time or Reactant.Profiler.@timed. We will automatically compile the function if it is not already a Reactant compiled function (with sync=true).
using Reactant

x = Reactant.to_rarray(randn(Float32, 100, 2))
W = Reactant.to_rarray(randn(Float32, 10, 100))
b = Reactant.to_rarray(randn(Float32, 10))

linear(x, W, b) = (W * x) .+ b

Reactant.@time linear(x, W, b)
┌ Debug: Profiling directory: /home/runner/.julia/scratchspaces/3c362404-f566-11ee-1572-e11a4b42c853/reactant_profiling/jl_iQveg6
└ @ Reactant.Profiler ~/work/Reactant.jl/Reactant.jl/src/Profiler.jl:626
WARNING: All log messages before absl::InitializeLog() is called are written to STDERR
I0000 00:00:1777581008.376370 2389 profiler_session.cc:119] Profiler session initializing.
I0000 00:00:1777581008.376431 2389 profiler_session.cc:134] Profiler session started.
I0000 00:00:1777581008.376692 2389 profiler_session.cc:82] Profiler session collecting data.
I0000 00:00:1777581008.377236 2389 save_profile.cc:150] Collecting XSpace to repository: /home/runner/.julia/scratchspaces/3c362404-f566-11ee-1572-e11a4b42c853/reactant_profiling/jl_iQveg6/plugins/profile/2026_04_30_20_30_08/runnervmeorf1.xplane.pb
I0000 00:00:1777581008.377376 2389 save_profile.cc:123] Creating directory: /home/runner/.julia/scratchspaces/3c362404-f566-11ee-1572-e11a4b42c853/reactant_profiling/jl_iQveg6/plugins/profile/2026_04_30_20_30_08
I0000 00:00:1777581008.377500 2389 save_profile.cc:129] Dumped gzipped tool data for trace.json.gz to /home/runner/.julia/scratchspaces/3c362404-f566-11ee-1572-e11a4b42c853/reactant_profiling/jl_iQveg6/plugins/profile/2026_04_30_20_30_08/runnervmeorf1.trace.json.gz
I0000 00:00:1777581008.377517 2389 profiler_session.cc:152] Profiler session tear down.
┌ Debug: Starting XProf gRPC server...
└ @ Reactant.Profiler ~/work/Reactant.jl/Reactant.jl/src/Profiler.jl:598
┌ Debug: Initializing XProf stubs for worker service at 0.0.0.0:45739
└ @ Reactant.Profiler ~/work/Reactant.jl/Reactant.jl/src/Profiler.jl:397
I0000 00:00:1777581008.394507 2389 stub_factory.cc:163] Created gRPC channel for address: 0.0.0.0:45739
┌ Debug: Starting XProf gRPC server on port 45739
└ @ Reactant.Profiler ~/work/Reactant.jl/Reactant.jl/src/Profiler.jl:413
I0000 00:00:1777581008.394945 2389 grpc_server.cc:94] Server listening on 0.0.0.0:45739 with max_concurrent_requests 1
I0000 00:00:1777581008.405390 2389 xplane_to_tools_data_with_profile_processor.cc:142] serving tool: memory_profile with options: {} using ProfileProcessor session_id: /home/runner/.julia/scratchspaces/3c362404-f566-11ee-1572-e11a4b42c853/reactant_profiling/jl_iQveg6/plugins/profile/2026_04_30_20_30_08
I0000 00:00:1777581008.405432 2389 xplane_to_tools_data_with_profile_processor.cc:165] Using local processing for tool: memory_profile
I0000 00:00:1777581008.405434 2389 memory_profile_processor.cc:47] Processing memory profile for host: runnervmeorf1
I0000 00:00:1777581008.405763 2389 xplane_to_tools_data_with_profile_processor.cc:170] Total time for tool memory_profile: 337.533us session_id: /home/runner/.julia/scratchspaces/3c362404-f566-11ee-1572-e11a4b42c853/reactant_profiling/jl_iQveg6/plugins/profile/2026_04_30_20_30_08
I0000 00:00:1777581008.421662 2389 xplane_to_tools_data_with_profile_processor.cc:142] serving tool: op_profile with options: {} using ProfileProcessor session_id: /home/runner/.julia/scratchspaces/3c362404-f566-11ee-1572-e11a4b42c853/reactant_profiling/jl_iQveg6/plugins/profile/2026_04_30_20_30_08
I0000 00:00:1777581008.421689 2389 xplane_to_tools_data_with_profile_processor.cc:165] Using local processing for tool: op_profile
I0000 00:00:1777581008.421692 2389 multi_xplanes_to_op_stats.cc:118] ConvertMultiXSpaceToCombinedOpStatsWithCache: Started
I0000 00:00:1777581008.421749 2389 multi_xplanes_to_op_stats.cc:134] ConvertMultiXSpaceToCombinedOpStatsWithCache: Cache miss, calling ConvertMultiXSpacesToCombinedOpStats
I0000 00:00:1777581008.421751 2389 multi_xplanes_to_op_stats.cc:45] ConvertMultiXSpacesToCombinedOpStats: Started. Number of XSpaces: 1
I0000 00:00:1777581008.421756 2389 multi_xplanes_to_op_stats.cc:55] ConvertMultiXSpacesToCombinedOpStats: Starting to process XSpace 0/1
I0000 00:00:1777581008.421903 2389 derived_timeline.cc:693] GenerateDerivedTimeLines: creating derived_timeline_trace_events XprofThreadPoolExecutor
I0000 00:00:1777581008.421912 2389 xprof_thread_pool_executor.cc:22] Creating derived_timeline_trace_events XprofThreadPoolExecutor with 4 threads.
I0000 00:00:1777581008.422135 2389 derived_timeline.cc:705] GenerateDerivedTimeLines: waiting for derived_timeline_trace_events threads to join
I0000 00:00:1777581008.422535 2389 derived_timeline.cc:709] GenerateDerivedTimeLines: derived_timeline_trace_events threads joined successfully
I0000 00:00:1777581008.422860 2389 derived_timeline.cc:758] GenerateDerivedTimeLines: creating ProcessTensorCorePlanes XprofThreadPoolExecutor
I0000 00:00:1777581008.422871 2389 xprof_thread_pool_executor.cc:22] Creating ProcessTensorCorePlanes XprofThreadPoolExecutor with 4 threads.
I0000 00:00:1777581008.423020 2389 derived_timeline.cc:769] GenerateDerivedTimeLines: waiting for ProcessTensorCorePlanes threads to join
I0000 00:00:1777581008.423563 2389 derived_timeline.cc:772] GenerateDerivedTimeLines: ProcessTensorCorePlanes threads joined successfully
I0000 00:00:1777581008.426915 2389 xplane_to_op_stats.cc:405] ConvertXSpaceToOpStats: creating op_stats_threads XprofThreadPoolExecutor
I0000 00:00:1777581008.426937 2389 xprof_thread_pool_executor.cc:22] Creating op_stats_threads XprofThreadPoolExecutor with 4 threads.
I0000 00:00:1777581008.427108 2389 xplane_to_op_stats.cc:461] ConvertXSpaceToOpStats: Scheduled 0 OpMetricsDb generation tasks.
I0000 00:00:1777581008.427318 2389 xplane_to_op_stats.cc:417] ConvertXSpaceToOpStats: Combining 0 op_metrics_dbs.
I0000 00:00:1777581008.427326 2389 xplane_to_op_stats.cc:422] ConvertXSpaceToOpStats: Finished combining op_metrics_dbs.
I0000 00:00:1777581008.427612 2389 xplane_to_op_stats.cc:687] ConvertXSpaceToOpStats: Final OpStats size: 221 bytes (0.000210762 MiB).
I0000 00:00:1777581008.427683 2389 multi_xplanes_to_op_stats.cc:67] ConvertMultiXSpacesToCombinedOpStats: Finished processing XSpace 0.
I0000 00:00:1777581008.427696 2389 multi_xplanes_to_op_stats.cc:72] ConvertMultiXSpacesToCombinedOpStats: Finished extracting all 1 OpStats. Time: 5.94689ms
I0000 00:00:1777581008.427703 2389 multi_xplanes_to_op_stats.cc:85] ConvertMultiXSpacesToCombinedOpStats: Starting ComputeStepIntersectionToMergeOpStats.
I0000 00:00:1777581008.427706 2389 multi_xplanes_to_op_stats.cc:94] ConvertMultiXSpacesToCombinedOpStats: Finished ComputeStepIntersectionToMergeOpStats in 2.215us
I0000 00:00:1777581008.427708 2389 multi_xplanes_to_op_stats.cc:99] ConvertMultiXSpacesToCombinedOpStats: Starting CombineAllOpStats.
I0000 00:00:1777581008.427712 2389 multi_xplanes_to_op_stats.cc:106] ConvertMultiXSpacesToCombinedOpStats: Finished CombineAllOpStats in 3.729us
I0000 00:00:1777581008.427714 2389 multi_xplanes_to_op_stats.cc:109] ConvertMultiXSpacesToCombinedOpStats: Overall Finished in 5.962928ms
I0000 00:00:1777581008.427716 2389 multi_xplanes_to_op_stats.cc:138] ConvertMultiXSpaceToCombinedOpStatsWithCache: Starting to write cache file.
I0000 00:00:1777581008.427805 2389 multi_xplanes_to_op_stats.cc:145] ConvertMultiXSpaceToCombinedOpStatsWithCache: Finished writing cache file.
I0000 00:00:1777581008.427808 2389 multi_xplanes_to_op_stats.cc:149] ConvertMultiXSpaceToCombinedOpStatsWithCache: Overall Finished in 6.116209ms
I0000 00:00:1777581008.427918 2389 xplane_to_tools_data_with_profile_processor.cc:170] Total time for tool op_profile: 6.234972ms session_id: /home/runner/.julia/scratchspaces/3c362404-f566-11ee-1572-e11a4b42c853/reactant_profiling/jl_iQveg6/plugins/profile/2026_04_30_20_30_08
┌ Debug: `op_profile` data missing keys for metrics
│ data_available_keys =
│ KeySet for a JSON.Object{String, Any} with 4 entries. Keys:
│ "byProgram"
│ "deviceType"
│ "byProgramExcludeIdle"
│ "aggDvfsTimeScaleMultiplier"
│ by_program_available_keys =
│ KeySet for a JSON.Object{String, Any} with 3 entries. Keys:
│ "name"
│ "children"
│ "numChildren"
└ @ Reactant.Profiler ~/work/Reactant.jl/Reactant.jl/src/Profiler.jl:816
I0000 00:00:1777581008.709267 2389 xplane_to_tools_data_with_profile_processor.cc:142] serving tool: overview_page with options: {} using ProfileProcessor session_id: /home/runner/.julia/scratchspaces/3c362404-f566-11ee-1572-e11a4b42c853/reactant_profiling/jl_iQveg6/plugins/profile/2026_04_30_20_30_08
I0000 00:00:1777581008.709288 2389 xplane_to_tools_data_with_profile_processor.cc:165] Using local processing for tool: overview_page
I0000 00:00:1777581008.709290 2389 overview_page_processor.cc:84] OverviewPageProcessor::ProcessSession: Started
I0000 00:00:1777581008.709292 2389 overview_page_processor.cc:86] OverviewPageProcessor::ProcessSession: Starting ConvertMultiXSpaceToCombinedOpStatsWithCache
I0000 00:00:1777581008.709294 2389 multi_xplanes_to_op_stats.cc:118] ConvertMultiXSpaceToCombinedOpStatsWithCache: Started
I0000 00:00:1777581008.709352 2389 multi_xplanes_to_op_stats.cc:126] ConvertMultiXSpaceToCombinedOpStatsWithCache: Cache hit, reading binary proto
I0000 00:00:1777581008.709407 2389 multi_xplanes_to_op_stats.cc:131] ConvertMultiXSpaceToCombinedOpStatsWithCache: Finished reading cache file.
I0000 00:00:1777581008.709409 2389 multi_xplanes_to_op_stats.cc:149] ConvertMultiXSpaceToCombinedOpStatsWithCache: Overall Finished in 115.9us
I0000 00:00:1777581008.709413 2389 overview_page_processor.cc:90] OverviewPageProcessor::ProcessSession: Starting ConvertOpStatsToOverviewPage
I0000 00:00:1777581008.709424 2389 op_stats_to_overview_page.cc:388] ConvertOpStatsToOverviewPage: Starting ComputeRunEnvironment
I0000 00:00:1777581008.709431 2389 op_stats_to_overview_page.cc:393] ConvertOpStatsToOverviewPage: Starting ComputeAnalysisResult
I0000 00:00:1777581008.709435 2389 op_stats_to_overview_page.cc:396] ConvertOpStatsToOverviewPage: Starting ConvertOpStatsToInputPipelineAnalysis
I0000 00:00:1777581008.709608 2389 op_stats_to_overview_page.cc:401] ConvertOpStatsToOverviewPage: Starting ComputeBottleneckAnalysis
I0000 00:00:1777581008.709618 2389 op_stats_to_overview_page.cc:407] ConvertOpStatsToOverviewPage: Starting ComputeGenericRecommendation
I0000 00:00:1777581008.709728 2389 op_stats_to_overview_page.cc:412] ConvertOpStatsToOverviewPage: Starting SetCommonRecommendation
I0000 00:00:1777581008.709746 2389 op_stats_to_overview_page.cc:425] ConvertOpStatsToOverviewPage: Starting PopulateOverviewDiagnostics
I0000 00:00:1777581008.709747 2389 op_stats_to_overview_page.cc:429] ConvertOpStatsToOverviewPage: Starting setting utilizations
I0000 00:00:1777581008.709749 2389 op_stats_to_overview_page.cc:435] ConvertOpStatsToOverviewPage: Overall Finished in 325.286us
I0000 00:00:1777581008.709751 2389 overview_page_processor.cc:94] OverviewPageProcessor::ProcessSession: Not a training run, Starting to convert inference stats.
I0000 00:00:1777581008.709758 2389 xprof_thread_pool_executor.cc:22] Creating ConvertMultiXSpaceToInferenceStats XprofThreadPoolExecutor with 1 threads.
I0000 00:00:1777581008.710138 2389 overview_page_processor.cc:99] OverviewPageProcessor::ProcessSession: Starting to compute InferenceLatency
I0000 00:00:1777581008.710146 2389 overview_page_processor.cc:104] OverviewPageProcessor::ProcessSession: Starting to serialize OverviewPage toJson
I0000 00:00:1777581008.710416 2389 overview_page_processor.cc:107] OverviewPageProcessor::ProcessSession: Starting to set Output
I0000 00:00:1777581008.710425 2389 overview_page_processor.cc:109] OverviewPageProcessor::ProcessSession: Overall Finished in 1.134887ms
I0000 00:00:1777581008.710438 2389 xplane_to_tools_data_with_profile_processor.cc:170] Total time for tool overview_page: 1.156401ms session_id: /home/runner/.julia/scratchspaces/3c362404-f566-11ee-1572-e11a4b42c853/reactant_profiling/jl_iQveg6/plugins/profile/2026_04_30_20_30_08
runtime: 0.00021057s
compile time: 3.92669619sReactant.@timed nrepeat=100 linear(x, W, b)AggregateProfilingResult(
runtime = 0.00003022s,
compile_time = 0.14887460s, )Note that the information returned depends on the backend. Specifically CUDA and TPU backends provide more detailed information regarding memory usage and allocation (something like the following will be displayed on GPUs):
AggregateProfilingResult(
    runtime = 0.00003829s,
    compile_time = 2.18053260s,  # time spent compiling by Reactant
    GPU_0_bfc = MemoryProfileSummary(
        peak_bytes_usage_lifetime = 64.010 MiB,  # peak memory usage over the entire program (lifetime of memory allocator)
        peak_stats = MemoryAggregationStats(
            stack_reserved_bytes = 0 bytes,  # memory usage by stack reservation
            heap_allocated_bytes = 30.750 KiB,  # memory usage by heap allocation
            free_memory_bytes = 23.518 GiB,  # free memory available for allocation or reservation
            fragmentation = 0.514931,  # fragmentation of memory within [0, 1]
            peak_bytes_in_use = 30.750 KiB # The peak memory usage over the entire program
        )
        peak_stats_time = 0.04975365s,
        memory_capacity = 23.518 GiB # memory capacity of the allocator
    )
    flops = FlopsSummary(
        Flops = 2.8369974648038653e-9,  # [flops / (peak flops * program time)], capped at 1.0
        UncappedFlops = 2.8369974648038653e-9,
        RawFlops = 4060.0,  # Total FLOPs performed
        BF16Flops = 4060.0,  # Total FLOPs Normalized to the bf16 (default) devices peak bandwidth
        RawTime = 0.00040298422s,  # Raw time in seconds
        RawFlopsRate = 1.0074836180930361e7,  # Raw FLOPs rate in FLOPs/seconds
        BF16FlopsRate = 1.0074836180930361e7,  # BF16 FLOPs rate in FLOPs/seconds
    )
)
Additionally for GPUs and TPUs, we can use the Reactant.@profile macro to profile the function and get information regarding each of the kernels executed.
Reactant.@profile linear(x, W, b)┌ Debug: Profiling directory: /home/runner/.julia/scratchspaces/3c362404-f566-11ee-1572-e11a4b42c853/reactant_profiling/jl_5GjGhF
└ @ Reactant.Profiler ~/work/Reactant.jl/Reactant.jl/src/Profiler.jl:626
I0000 00:00:1777581009.483418 2389 profiler_session.cc:119] Profiler session initializing.
I0000 00:00:1777581009.483753 2389 profiler_session.cc:134] Profiler session started.
I0000 00:00:1777581009.484247 2389 profiler_session.cc:82] Profiler session collecting data.
I0000 00:00:1777581009.484787 2389 save_profile.cc:150] Collecting XSpace to repository: /home/runner/.julia/scratchspaces/3c362404-f566-11ee-1572-e11a4b42c853/reactant_profiling/jl_5GjGhF/plugins/profile/2026_04_30_20_30_09/runnervmeorf1.xplane.pb
I0000 00:00:1777581009.484926 2389 save_profile.cc:123] Creating directory: /home/runner/.julia/scratchspaces/3c362404-f566-11ee-1572-e11a4b42c853/reactant_profiling/jl_5GjGhF/plugins/profile/2026_04_30_20_30_09
I0000 00:00:1777581009.485027 2389 save_profile.cc:129] Dumped gzipped tool data for trace.json.gz to /home/runner/.julia/scratchspaces/3c362404-f566-11ee-1572-e11a4b42c853/reactant_profiling/jl_5GjGhF/plugins/profile/2026_04_30_20_30_09/runnervmeorf1.trace.json.gz
I0000 00:00:1777581009.485043 2389 profiler_session.cc:152] Profiler session tear down.
I0000 00:00:1777581009.485114 2389 xplane_to_tools_data_with_profile_processor.cc:142] serving tool: memory_profile with options: {} using ProfileProcessor session_id: /home/runner/.julia/scratchspaces/3c362404-f566-11ee-1572-e11a4b42c853/reactant_profiling/jl_5GjGhF/plugins/profile/2026_04_30_20_30_09
I0000 00:00:1777581009.485122 2389 xplane_to_tools_data_with_profile_processor.cc:165] Using local processing for tool: memory_profile
I0000 00:00:1777581009.485124 2389 memory_profile_processor.cc:47] Processing memory profile for host: runnervmeorf1
I0000 00:00:1777581009.485289 2389 xplane_to_tools_data_with_profile_processor.cc:170] Total time for tool memory_profile: 171.827us session_id: /home/runner/.julia/scratchspaces/3c362404-f566-11ee-1572-e11a4b42c853/reactant_profiling/jl_5GjGhF/plugins/profile/2026_04_30_20_30_09
I0000 00:00:1777581009.485314 2389 xplane_to_tools_data_with_profile_processor.cc:142] serving tool: op_profile with options: {} using ProfileProcessor session_id: /home/runner/.julia/scratchspaces/3c362404-f566-11ee-1572-e11a4b42c853/reactant_profiling/jl_5GjGhF/plugins/profile/2026_04_30_20_30_09
I0000 00:00:1777581009.485318 2389 xplane_to_tools_data_with_profile_processor.cc:165] Using local processing for tool: op_profile
I0000 00:00:1777581009.485320 2389 multi_xplanes_to_op_stats.cc:118] ConvertMultiXSpaceToCombinedOpStatsWithCache: Started
I0000 00:00:1777581009.485338 2389 multi_xplanes_to_op_stats.cc:134] ConvertMultiXSpaceToCombinedOpStatsWithCache: Cache miss, calling ConvertMultiXSpacesToCombinedOpStats
I0000 00:00:1777581009.485340 2389 multi_xplanes_to_op_stats.cc:45] ConvertMultiXSpacesToCombinedOpStats: Started. Number of XSpaces: 1
I0000 00:00:1777581009.485344 2389 multi_xplanes_to_op_stats.cc:55] ConvertMultiXSpacesToCombinedOpStats: Starting to process XSpace 0/1
I0000 00:00:1777581009.485444 2389 derived_timeline.cc:693] GenerateDerivedTimeLines: creating derived_timeline_trace_events XprofThreadPoolExecutor
I0000 00:00:1777581009.485452 2389 xprof_thread_pool_executor.cc:22] Creating derived_timeline_trace_events XprofThreadPoolExecutor with 4 threads.
I0000 00:00:1777581009.485630 2389 derived_timeline.cc:705] GenerateDerivedTimeLines: waiting for derived_timeline_trace_events threads to join
I0000 00:00:1777581009.485833 2389 derived_timeline.cc:709] GenerateDerivedTimeLines: derived_timeline_trace_events threads joined successfully
I0000 00:00:1777581009.486278 2389 derived_timeline.cc:758] GenerateDerivedTimeLines: creating ProcessTensorCorePlanes XprofThreadPoolExecutor
I0000 00:00:1777581009.486295 2389 xprof_thread_pool_executor.cc:22] Creating ProcessTensorCorePlanes XprofThreadPoolExecutor with 4 threads.
I0000 00:00:1777581009.486451 2389 derived_timeline.cc:769] GenerateDerivedTimeLines: waiting for ProcessTensorCorePlanes threads to join
I0000 00:00:1777581009.486682 2389 derived_timeline.cc:772] GenerateDerivedTimeLines: ProcessTensorCorePlanes threads joined successfully
I0000 00:00:1777581009.487179 2389 xplane_to_op_stats.cc:405] ConvertXSpaceToOpStats: creating op_stats_threads XprofThreadPoolExecutor
I0000 00:00:1777581009.487202 2389 xprof_thread_pool_executor.cc:22] Creating op_stats_threads XprofThreadPoolExecutor with 4 threads.
I0000 00:00:1777581009.487343 2389 xplane_to_op_stats.cc:461] ConvertXSpaceToOpStats: Scheduled 0 OpMetricsDb generation tasks.
I0000 00:00:1777581009.487584 2389 xplane_to_op_stats.cc:417] ConvertXSpaceToOpStats: Combining 0 op_metrics_dbs.
I0000 00:00:1777581009.487593 2389 xplane_to_op_stats.cc:422] ConvertXSpaceToOpStats: Finished combining op_metrics_dbs.
I0000 00:00:1777581009.487782 2389 xplane_to_op_stats.cc:687] ConvertXSpaceToOpStats: Final OpStats size: 267 bytes (0.000254631 MiB).
I0000 00:00:1777581009.487858 2389 multi_xplanes_to_op_stats.cc:67] ConvertMultiXSpacesToCombinedOpStats: Finished processing XSpace 0.
I0000 00:00:1777581009.487883 2389 multi_xplanes_to_op_stats.cc:72] ConvertMultiXSpacesToCombinedOpStats: Finished extracting all 1 OpStats. Time: 2.545268ms
I0000 00:00:1777581009.487889 2389 multi_xplanes_to_op_stats.cc:85] ConvertMultiXSpacesToCombinedOpStats: Starting ComputeStepIntersectionToMergeOpStats.
I0000 00:00:1777581009.487892 2389 multi_xplanes_to_op_stats.cc:94] ConvertMultiXSpacesToCombinedOpStats: Finished ComputeStepIntersectionToMergeOpStats in 1.696us
I0000 00:00:1777581009.487893 2389 multi_xplanes_to_op_stats.cc:99] ConvertMultiXSpacesToCombinedOpStats: Starting CombineAllOpStats.
I0000 00:00:1777581009.487898 2389 multi_xplanes_to_op_stats.cc:106] ConvertMultiXSpacesToCombinedOpStats: Finished CombineAllOpStats in 3.588us
I0000 00:00:1777581009.487899 2389 multi_xplanes_to_op_stats.cc:109] ConvertMultiXSpacesToCombinedOpStats: Overall Finished in 2.559915ms
I0000 00:00:1777581009.487902 2389 multi_xplanes_to_op_stats.cc:138] ConvertMultiXSpaceToCombinedOpStatsWithCache: Starting to write cache file.
I0000 00:00:1777581009.487974 2389 multi_xplanes_to_op_stats.cc:145] ConvertMultiXSpaceToCombinedOpStatsWithCache: Finished writing cache file.
I0000 00:00:1777581009.487976 2389 multi_xplanes_to_op_stats.cc:149] ConvertMultiXSpaceToCombinedOpStatsWithCache: Overall Finished in 2.656756ms
I0000 00:00:1777581009.488002 2389 xplane_to_tools_data_with_profile_processor.cc:170] Total time for tool op_profile: 2.686571ms session_id: /home/runner/.julia/scratchspaces/3c362404-f566-11ee-1572-e11a4b42c853/reactant_profiling/jl_5GjGhF/plugins/profile/2026_04_30_20_30_09
┌ Debug: `op_profile` data missing keys for metrics
│ data_available_keys =
│ KeySet for a JSON.Object{String, Any} with 4 entries. Keys:
│ "byProgram"
│ "deviceType"
│ "byProgramExcludeIdle"
│ "aggDvfsTimeScaleMultiplier"
│ by_program_available_keys =
│ KeySet for a JSON.Object{String, Any} with 3 entries. Keys:
│ "name"
│ "children"
│ "numChildren"
└ @ Reactant.Profiler ~/work/Reactant.jl/Reactant.jl/src/Profiler.jl:816
I0000 00:00:1777581009.488438 2389 xplane_to_tools_data_with_profile_processor.cc:142] serving tool: overview_page with options: {} using ProfileProcessor session_id: /home/runner/.julia/scratchspaces/3c362404-f566-11ee-1572-e11a4b42c853/reactant_profiling/jl_5GjGhF/plugins/profile/2026_04_30_20_30_09
I0000 00:00:1777581009.488449 2389 xplane_to_tools_data_with_profile_processor.cc:165] Using local processing for tool: overview_page
I0000 00:00:1777581009.488451 2389 overview_page_processor.cc:84] OverviewPageProcessor::ProcessSession: Started
I0000 00:00:1777581009.488453 2389 overview_page_processor.cc:86] OverviewPageProcessor::ProcessSession: Starting ConvertMultiXSpaceToCombinedOpStatsWithCache
I0000 00:00:1777581009.488454 2389 multi_xplanes_to_op_stats.cc:118] ConvertMultiXSpaceToCombinedOpStatsWithCache: Started
I0000 00:00:1777581009.488485 2389 multi_xplanes_to_op_stats.cc:126] ConvertMultiXSpaceToCombinedOpStatsWithCache: Cache hit, reading binary proto
I0000 00:00:1777581009.488517 2389 multi_xplanes_to_op_stats.cc:131] ConvertMultiXSpaceToCombinedOpStatsWithCache: Finished reading cache file.
I0000 00:00:1777581009.488519 2389 multi_xplanes_to_op_stats.cc:149] ConvertMultiXSpaceToCombinedOpStatsWithCache: Overall Finished in 65.02us
I0000 00:00:1777581009.488521 2389 overview_page_processor.cc:90] OverviewPageProcessor::ProcessSession: Starting ConvertOpStatsToOverviewPage
I0000 00:00:1777581009.488523 2389 op_stats_to_overview_page.cc:388] ConvertOpStatsToOverviewPage: Starting ComputeRunEnvironment
I0000 00:00:1777581009.488527 2389 op_stats_to_overview_page.cc:393] ConvertOpStatsToOverviewPage: Starting ComputeAnalysisResult
I0000 00:00:1777581009.488530 2389 op_stats_to_overview_page.cc:396] ConvertOpStatsToOverviewPage: Starting ConvertOpStatsToInputPipelineAnalysis
I0000 00:00:1777581009.488566 2389 op_stats_to_overview_page.cc:401] ConvertOpStatsToOverviewPage: Starting ComputeBottleneckAnalysis
I0000 00:00:1777581009.488570 2389 op_stats_to_overview_page.cc:407] ConvertOpStatsToOverviewPage: Starting ComputeGenericRecommendation
I0000 00:00:1777581009.488575 2389 op_stats_to_overview_page.cc:412] ConvertOpStatsToOverviewPage: Starting SetCommonRecommendation
I0000 00:00:1777581009.488583 2389 op_stats_to_overview_page.cc:425] ConvertOpStatsToOverviewPage: Starting PopulateOverviewDiagnostics
I0000 00:00:1777581009.488585 2389 op_stats_to_overview_page.cc:429] ConvertOpStatsToOverviewPage: Starting setting utilizations
I0000 00:00:1777581009.488586 2389 op_stats_to_overview_page.cc:435] ConvertOpStatsToOverviewPage: Overall Finished in 63.306us
I0000 00:00:1777581009.488588 2389 overview_page_processor.cc:94] OverviewPageProcessor::ProcessSession: Not a training run, Starting to convert inference stats.
I0000 00:00:1777581009.488592 2389 xprof_thread_pool_executor.cc:22] Creating ConvertMultiXSpaceToInferenceStats XprofThreadPoolExecutor with 1 threads.
I0000 00:00:1777581009.488857 2389 overview_page_processor.cc:99] OverviewPageProcessor::ProcessSession: Starting to compute InferenceLatency
I0000 00:00:1777581009.488863 2389 overview_page_processor.cc:104] OverviewPageProcessor::ProcessSession: Starting to serialize OverviewPage toJson
I0000 00:00:1777581009.489096 2389 overview_page_processor.cc:107] OverviewPageProcessor::ProcessSession: Starting to set Output
I0000 00:00:1777581009.489105 2389 overview_page_processor.cc:109] OverviewPageProcessor::ProcessSession: Overall Finished in 655.117us
I0000 00:00:1777581009.489115 2389 xplane_to_tools_data_with_profile_processor.cc:170] Total time for tool overview_page: 671.772us session_id: /home/runner/.julia/scratchspaces/3c362404-f566-11ee-1572-e11a4b42c853/reactant_profiling/jl_5GjGhF/plugins/profile/2026_04_30_20_30_09
I0000 00:00:1777581009.581844 2389 xplane_to_tools_data_with_profile_processor.cc:142] serving tool: kernel_stats with options: {} using ProfileProcessor session_id: /home/runner/.julia/scratchspaces/3c362404-f566-11ee-1572-e11a4b42c853/reactant_profiling/jl_5GjGhF/plugins/profile/2026_04_30_20_30_09
I0000 00:00:1777581009.581875 2389 xplane_to_tools_data_with_profile_processor.cc:165] Using local processing for tool: kernel_stats
I0000 00:00:1777581009.581878 2389 multi_xplanes_to_op_stats.cc:118] ConvertMultiXSpaceToCombinedOpStatsWithCache: Started
I0000 00:00:1777581009.581931 2389 multi_xplanes_to_op_stats.cc:126] ConvertMultiXSpaceToCombinedOpStatsWithCache: Cache hit, reading binary proto
I0000 00:00:1777581009.581978 2389 multi_xplanes_to_op_stats.cc:131] ConvertMultiXSpaceToCombinedOpStatsWithCache: Finished reading cache file.
I0000 00:00:1777581009.581980 2389 multi_xplanes_to_op_stats.cc:149] ConvertMultiXSpaceToCombinedOpStatsWithCache: Overall Finished in 101.824us
I0000 00:00:1777581009.582047 2389 xplane_to_tools_data_with_profile_processor.cc:170] Total time for tool kernel_stats: 178.072us session_id: /home/runner/.julia/scratchspaces/3c362404-f566-11ee-1572-e11a4b42c853/reactant_profiling/jl_5GjGhF/plugins/profile/2026_04_30_20_30_09
I0000 00:00:1777581009.714296 2389 xplane_to_tools_data_with_profile_processor.cc:142] serving tool: framework_op_stats with options: {} using ProfileProcessor session_id: /home/runner/.julia/scratchspaces/3c362404-f566-11ee-1572-e11a4b42c853/reactant_profiling/jl_5GjGhF/plugins/profile/2026_04_30_20_30_09
I0000 00:00:1777581009.714328 2389 xplane_to_tools_data_with_profile_processor.cc:165] Using local processing for tool: framework_op_stats
I0000 00:00:1777581009.714330 2389 multi_xplanes_to_op_stats.cc:118] ConvertMultiXSpaceToCombinedOpStatsWithCache: Started
I0000 00:00:1777581009.714382 2389 multi_xplanes_to_op_stats.cc:126] ConvertMultiXSpaceToCombinedOpStatsWithCache: Cache hit, reading binary proto
I0000 00:00:1777581009.714436 2389 multi_xplanes_to_op_stats.cc:131] ConvertMultiXSpaceToCombinedOpStatsWithCache: Finished reading cache file.
I0000 00:00:1777581009.714438 2389 multi_xplanes_to_op_stats.cc:149] ConvertMultiXSpaceToCombinedOpStatsWithCache: Overall Finished in 108.207us
I0000 00:00:1777581009.714601 2389 xplane_to_tools_data_with_profile_processor.cc:170] Total time for tool framework_op_stats: 277.284us session_id: /home/runner/.julia/scratchspaces/3c362404-f566-11ee-1572-e11a4b42c853/reactant_profiling/jl_5GjGhF/plugins/profile/2026_04_30_20_30_09
╔================================================================================╗
║ SUMMARY ║
╚================================================================================╝
AggregateProfilingResult(
runtime = 0.00046633s,
compile_time = 0.13933072s, # time spent compiling by Reactant
)On GPUs this would look something like the following:
╔================================================================================╗
║ KERNEL STATISTICS                                                              ║
╚================================================================================╝

┌───────────────────┬─────────────┬────────────────┬──────────────┬──────────────┬──────────────┬──────────────┬───────────┬──────────┬────────────┬─────────────┐
│       Kernel Name │ Occurrences │ Total Duration │ Avg Duration │ Min Duration │ Max Duration │ Static Shmem │ Block Dim │ Grid Dim │ TensorCore │ Occupancy % │
├───────────────────┼─────────────┼────────────────┼──────────────┼──────────────┼──────────────┼──────────────┼───────────┼──────────┼────────────┼─────────────┤
│ gemm_fusion_dot_1 │           1 │    0.00000250s │  0.00000250s │  0.00000250s │  0.00000250s │    2.000 KiB │    64,1,1 │    1,1,1 │          ✗ │      100.0% │
│   loop_add_fusion │           1 │    0.00000131s │  0.00000131s │  0.00000131s │  0.00000131s │      0 bytes │    20,1,1 │    1,1,1 │          ✗ │       31.2% │
└───────────────────┴─────────────┴────────────────┴──────────────┴──────────────┴──────────────┴──────────────┴───────────┴──────────┴────────────┴─────────────┘

╔================================================================================╗
║ FRAMEWORK OP STATISTICS                                                        ║
╚================================================================================╝

┌───────────────────┬─────────┬─────────────┬─────────────┬─────────────────┬───────────────┬──────────┬───────────┬──────────────┬──────────┐
│         Operation │    Type │ Host/Device │ Occurrences │ Total Self-Time │ Avg Self-Time │ Device % │ Memory BW │    FLOP Rate │ Bound By │
├───────────────────┼─────────┼─────────────┼─────────────┼─────────────────┼───────────────┼──────────┼───────────┼──────────────┼──────────┤
│ gemm_fusion_dot.1 │ Unknown │      Device │           1 │     0.00000250s │   0.00000250s │   65.55% │ 1.82 GB/s │  1.6 GFLOP/s │      HBM │
│             +/add │     add │      Device │           1 │     0.00000131s │   0.00000131s │   34.45% │ 0.14 GB/s │ 0.05 GFLOP/s │      HBM │
└───────────────────┴─────────┴─────────────┴─────────────┴─────────────────┴───────────────┴──────────┴───────────┴──────────────┴──────────┘

╔================================================================================╗
║ SUMMARY                                                                        ║
╚================================================================================╝

AggregateProfilingResult(
    runtime = 0.00005622s,
    compile_time = 2.32802137s,  # time spent compiling by Reactant
    GPU_0_bfc = MemoryProfileSummary(
        peak_bytes_usage_lifetime = 64.010 MiB,  # peak memory usage over the entire program (lifetime of memory allocator)
        peak_stats = MemoryAggregationStats(
            stack_reserved_bytes = 0 bytes,  # memory usage by stack reservation
            heap_allocated_bytes = 81.750 KiB,  # memory usage by heap allocation
            free_memory_bytes = 23.518 GiB,  # free memory available for allocation or reservation
            fragmentation = 0.514564,  # fragmentation of memory within [0, 1]
            peak_bytes_in_use = 81.750 KiB # The peak memory usage over the entire program
        )
        peak_stats_time = 0.00608052s,
        memory_capacity = 23.518 GiB # memory capacity of the allocator
    )
    flops = FlopsSummary(
        Flops = 2.033375207640664e-8,  # [flops / (peak flops * program time)], capped at 1.0
        UncappedFlops = 2.033375207640664e-8,
        RawFlops = 4060.0,  # Total FLOPs performed
        BF16Flops = 4060.0,  # Total FLOPs Normalized to the bf16 (default) devices peak bandwidth
        RawTime = 0.00005622s,  # Raw time in seconds
        RawFlopsRate = 7.220987105380169e7,  # Raw FLOPs rate in FLOPs/seconds
        BF16FlopsRate = 7.220987105380169e7,  # BF16 FLOPs rate in FLOPs/seconds
    )
)
Capturing traces
When running Reactant, it is possible to capture traces using the XLA profiler. These traces can provide information about where the XLA specific parts of program spend time during compilation or execution. Note that tracing and compilation happen on the CPU even though the final execution is aimed to run on another device such as GPU or TPU. Therefore, including tracing and compilation in a trace will create annotations on the CPU.
Let's setup a simple function which we can then profile
using Reactant

x = Reactant.to_rarray(randn(Float32, 100, 2))
W = Reactant.to_rarray(randn(Float32, 10, 100))
b = Reactant.to_rarray(randn(Float32, 10))

linear(x, W, b) = (W * x) .+ b
linear (generic function with 1 method)The profiler can be accessed using the Reactant.with_profiler function.
Reactant.with_profiler("./") do
    mylinear = Reactant.@compile linear(x, W, b)
    mylinear(x, W, b)
end
10×2 ConcretePJRTArray{Float32,2}:
-18.2189 -0.909086
1.65872 1.83677
-0.151828 4.63711
-4.05836 11.9125
7.98674 2.03331
-2.72294 -5.72159
1.36349 -11.5426
-1.69077 -6.35961
0.748337 2.18803
-5.38628 16.0023Running this function should create a folder called plugins in the folder provided to Reactant.with_profiler which will contain the trace files. The traces can then be visualized in different ways.
Note
For more insights about the current state of Reactant, it is possible to fetch device information about allocations using the Reactant.XLA.allocatorstats function.
Perfetto UI
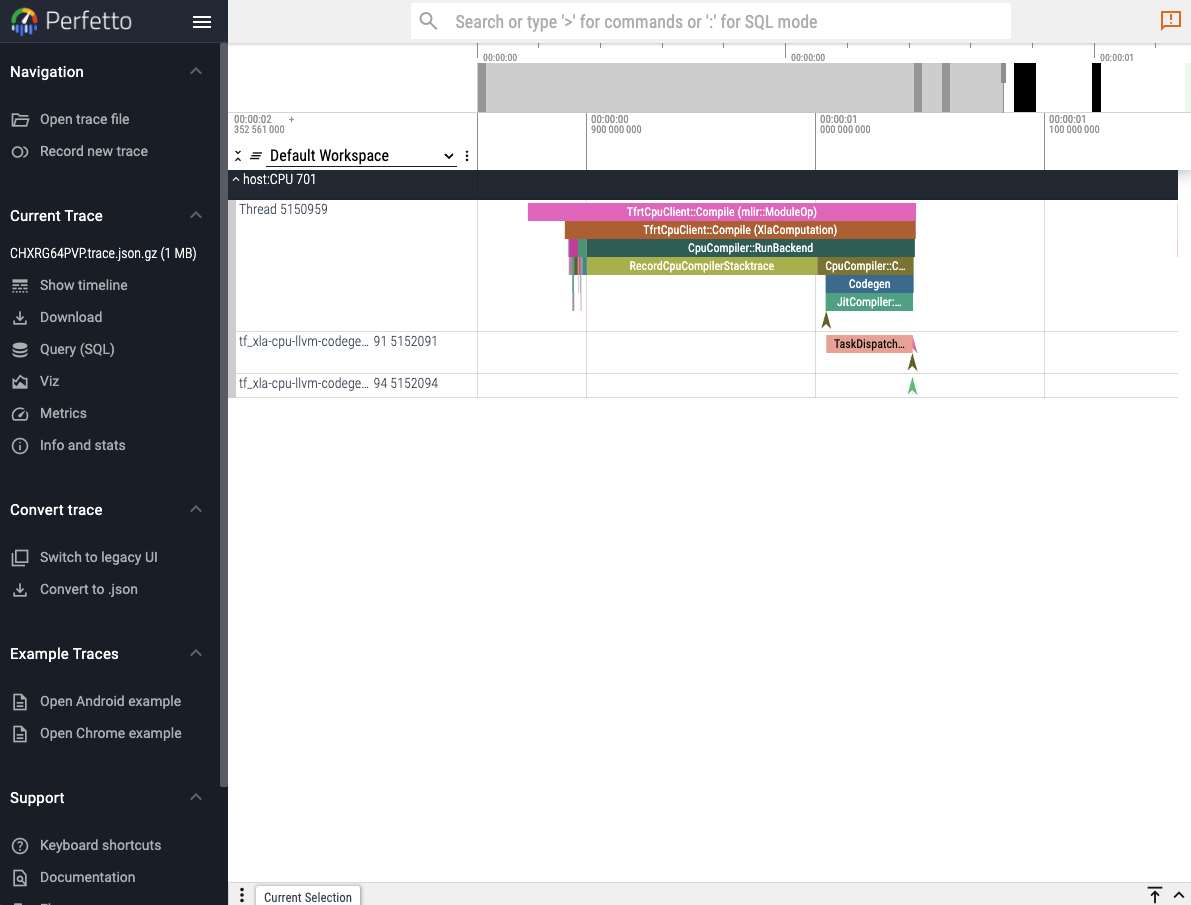
The first and easiest way to visualize a captured trace is to use the online perfetto.dev tool. Reactant.with_profiler has a keyword parameter called create_perfetto_link which will create a usable perfetto URL for the generated trace. The function will block execution until the URL has been clicked and the trace is visualized. The URL only works once.
Reactant.with_profiler("./"; create_perfetto_link=true) do
    mylinear = Reactant.@compile linear(x, W, b)
    mylinear(x, W, b)
end
Note
It is recommended to use the Chrome browser to open the perfetto URL.
XProf
XProf is a complete web UI to analyze the log files captured by Reactant. It can be installed in the following manner:
pip install xprof # or xprof-nightlyLaunching xprof is then as simple as:
xprof --logdir=./which will then make the xprof interface available on port :8791 by default.
Tensorboard
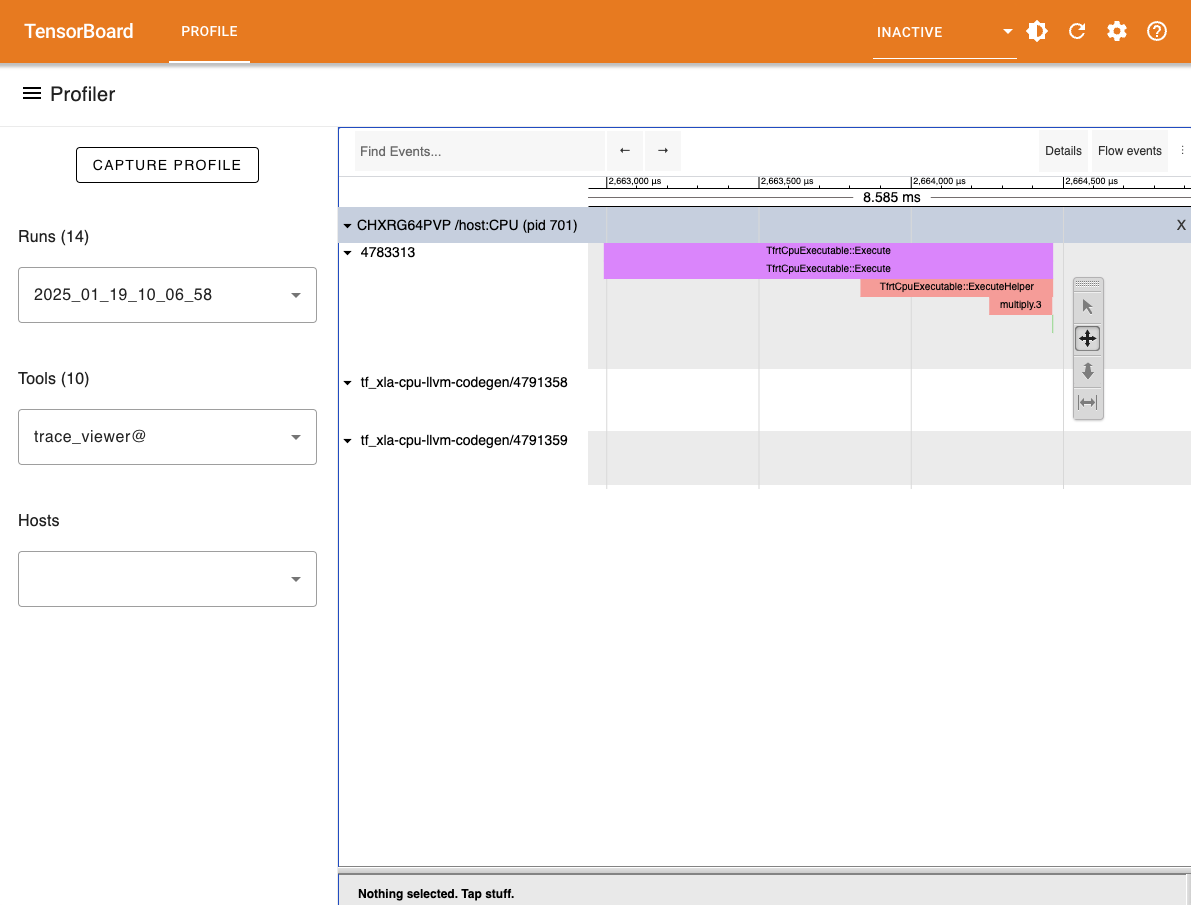
Another option to visualize the generated trace files is to use the tensorboard profiler plugin. The tensorboard viewer can offer more details than the timeline view such as visualization for compute graphs.
First install tensorboard and its profiler plugin:
pip install tensorboard tensorboard-plugin-profileAnd then run the following in the folder where the plugins folder was generated:
tensorboard --logdir ./Adding Custom Annotations
By default, the traces contain only information captured from within XLA. The Reactant.Profiler.annotate function can be used to annotate traces for Julia code evaluated during tracing.
Reactant.Profiler.annotate("my_annotation") do
    # Do things...
end
The added annotations will be captured in the traces and can be seen in the different viewers along with the default XLA annotations. When the profiler is not activated, then the custom annotations have no effect and can therefore always be activated.